Maps
Common map properties and controls
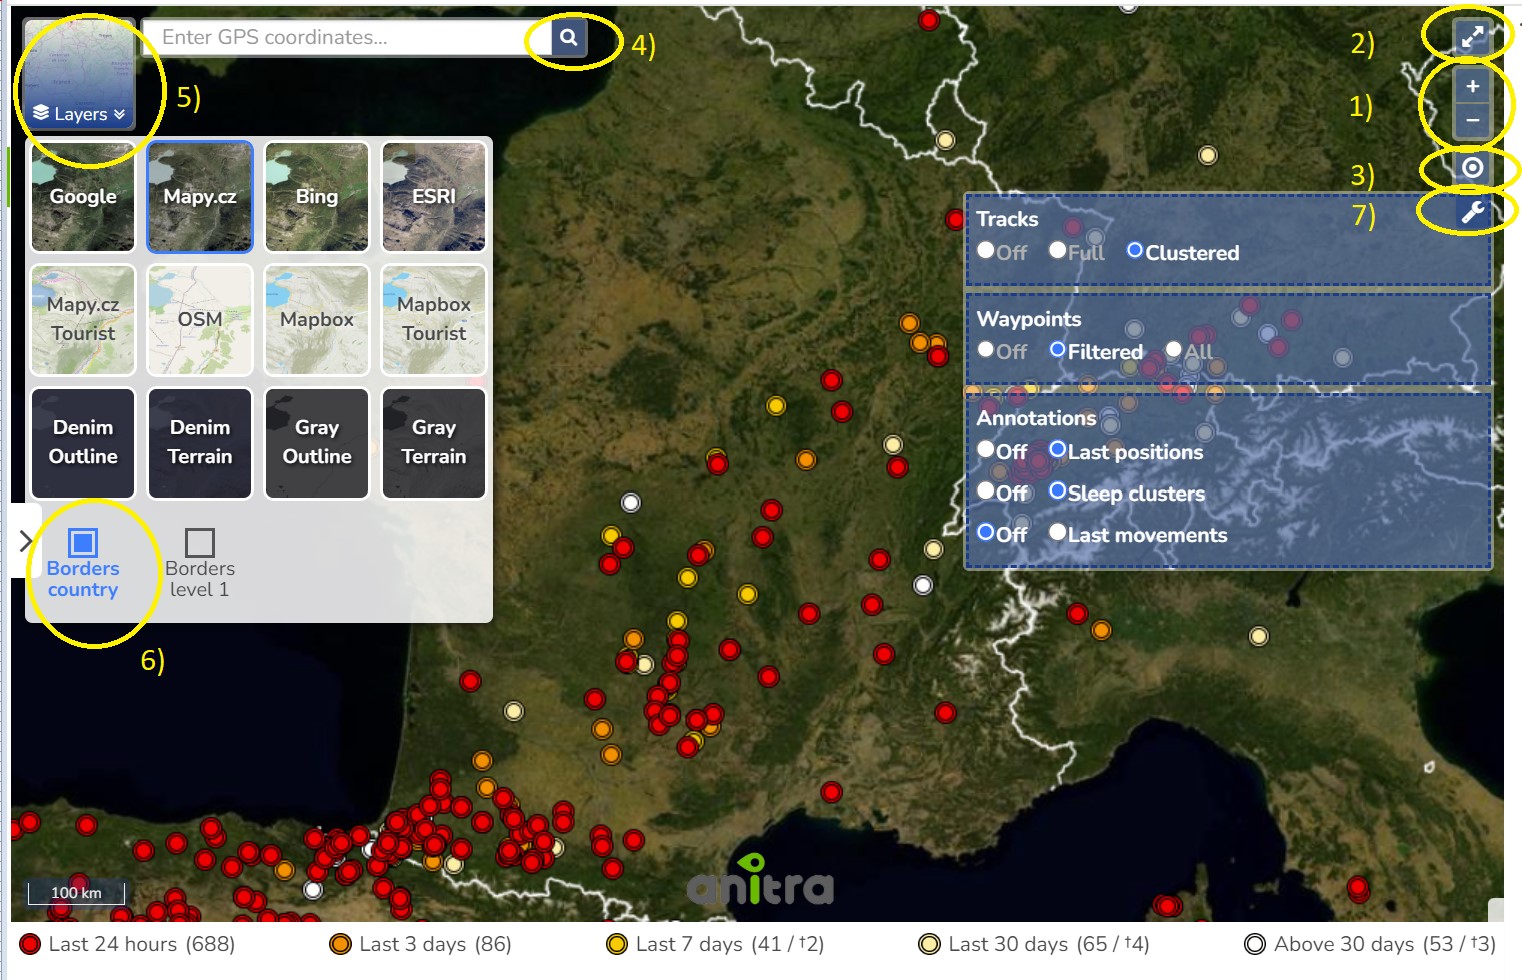
1) Map zoom
- Note besides the zoom buttons you can zoom the map
- using the mouse scroll wheel
- or by double-clicking the left mouse button (to zoom in) and the right button (to zoom out)
2) Full-screen mode
3) Shows the user/device's current position on the map as a blue dot
4) GPS search tool - various GPS formats accepted (e.g. decimal degrees such as "52.7761 27.811889")
5) Background maps
- a wide range of background maps of various types
- transparent overlays (country and admin borders)
6) Transparent map overlays
- country borders
- admin leve1 1 borders
7) Map options
- Tracks - note the option "Clustered" simplifies the track by removing movements within clusters
- Waypoints - note the option "All" suppresses the default performance optimisation behavior (= option "Filtered") - i.e. enforces showing of all the waypoints
- Annotations (aka Clusters) - currently these two Annotatin/Cluster types availabe to be used
- Last positions - show/hide the last position of the tracking
- Sleep clusters - show/hide the sleep clusters (data from periods defined by solar night/day i.e. by sun angle)
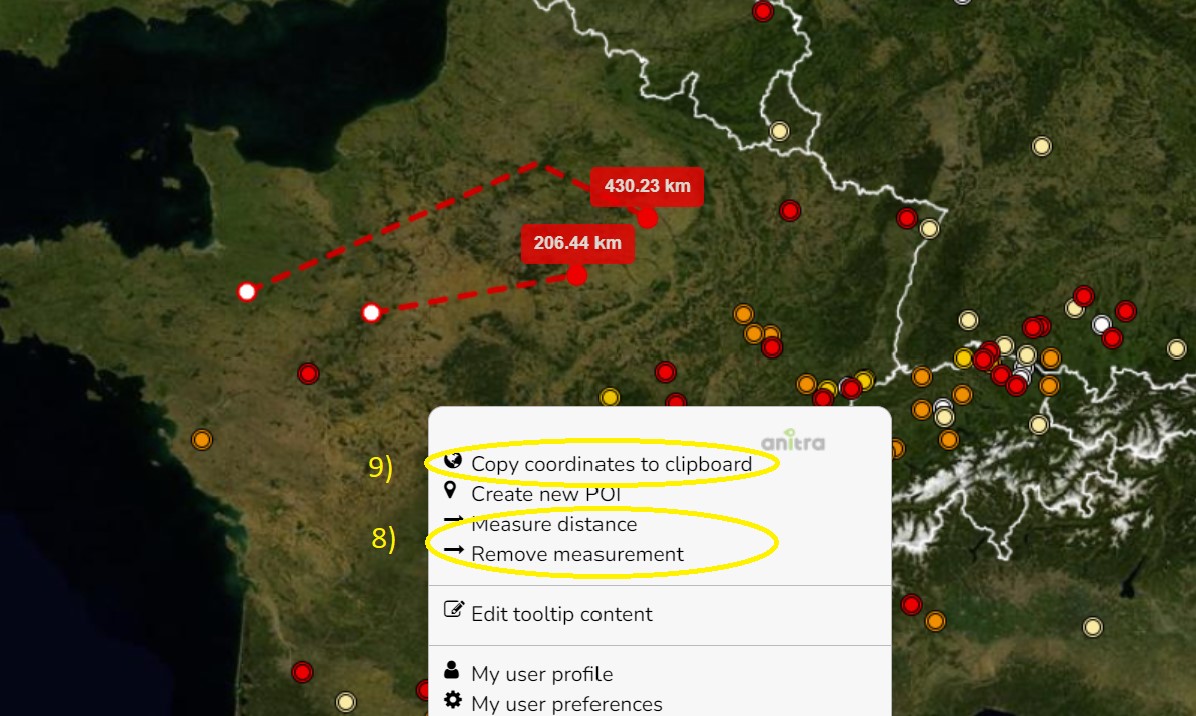
8) Copy coordinates to clipboard
- using left click context menu
9) Measure distance
- using left click context menu
MAIN MAP (TRACKINGS): Where do I see more animals in one map?
A tool to analyze multiple Trackings / Individuals in a single map.
The functionality displays all the Tracked Individuals available to a user (both owned/administered and shared only)
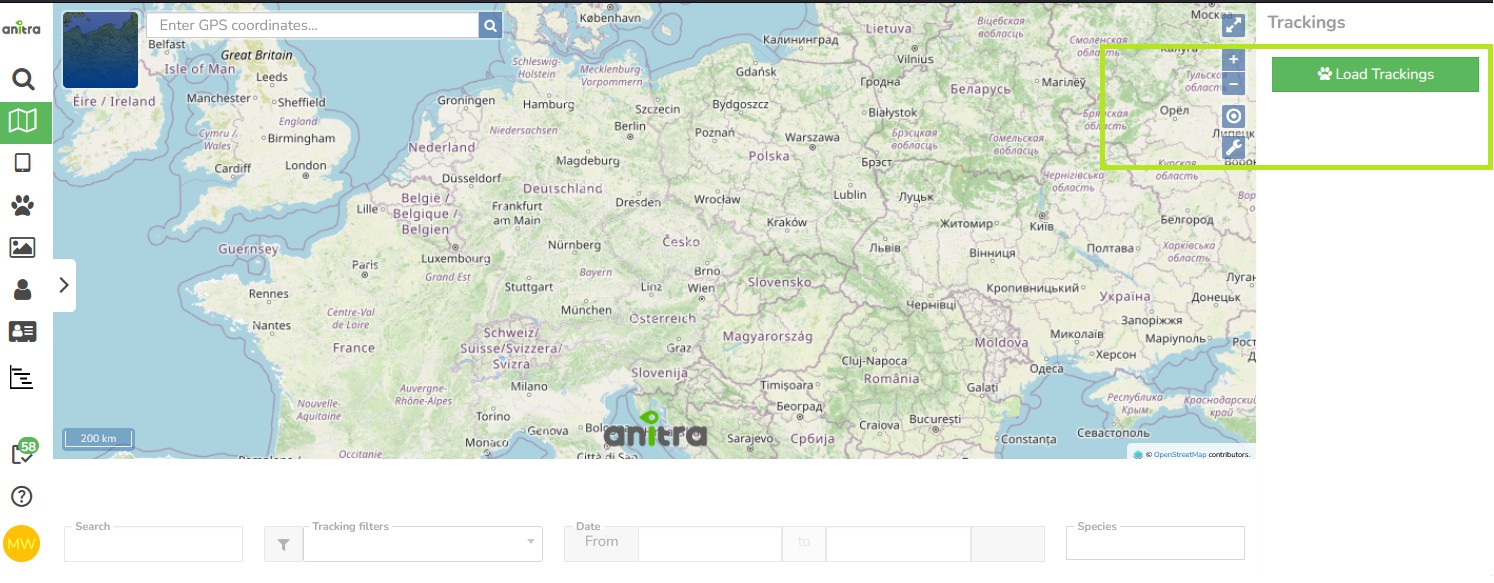
The map opens empty and waits for you. Loading every tracking at once is slow for accounts with hundreds or thousands of them, so the start view shows the map alone - the panel on the right holds nothing but a Load Trackings button, and the filters below the map stay empty until there is data to work with.
- Press Load Trackings to fetch them. The tracking list, the filters and the last positions appear once loading finishes.
- The button matters most for large accounts; with only a few trackings the map is ready almost immediately.
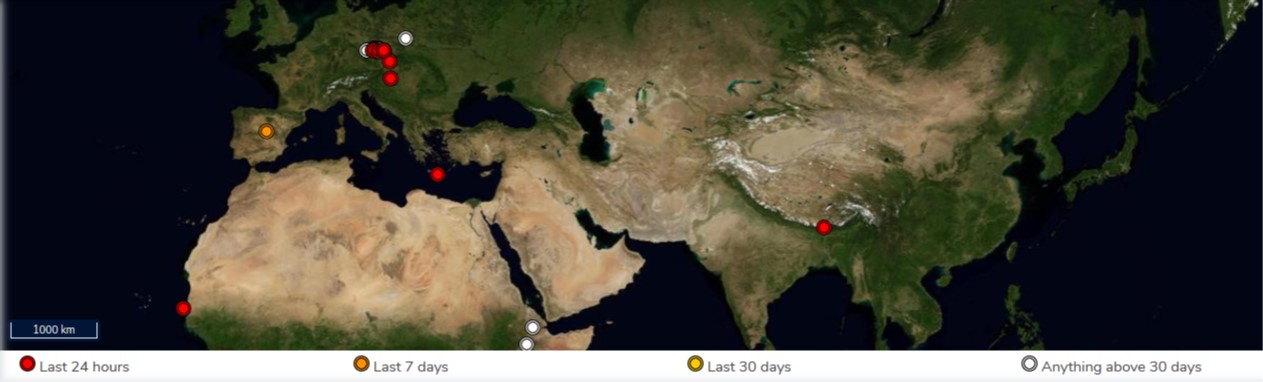
Once loaded, the overview shows the last positions - the color of the point classifies the last positions by the last update.
The map can also show supporting datasets - points of interest, observations and territory borders - from a panel on its left side. They have their own section: MAIN MAP (POIs & Events) below.
Filtering functionality below the map limits the data in the map (and in the right Tracking list panel]
- The three quick filter conditions ("Search", "Tracking filters", "Species") directly filter matching/not matching Trackings/Animals
- "Search": a full-text search across Device/Tracking/Animal codes/names/aliases
- "Tracking filters": existing Tracking filters created by the user can be reused here in the map. This allows applying very complex filter conditions in the map
- "Species": an obvious and simple quick filter conditions
- Note that the "Days filter" works differently - it uses a time filter over telemetry data first and based on that it leaves or removes Trackings/Animals from the page
- it excludes all the trackings with data outside of the time interval
- for overlapping Trackings/Animals it limits data/tracks in the map according to the interval defined - i.e. only relevant parts of the tracks are loaded
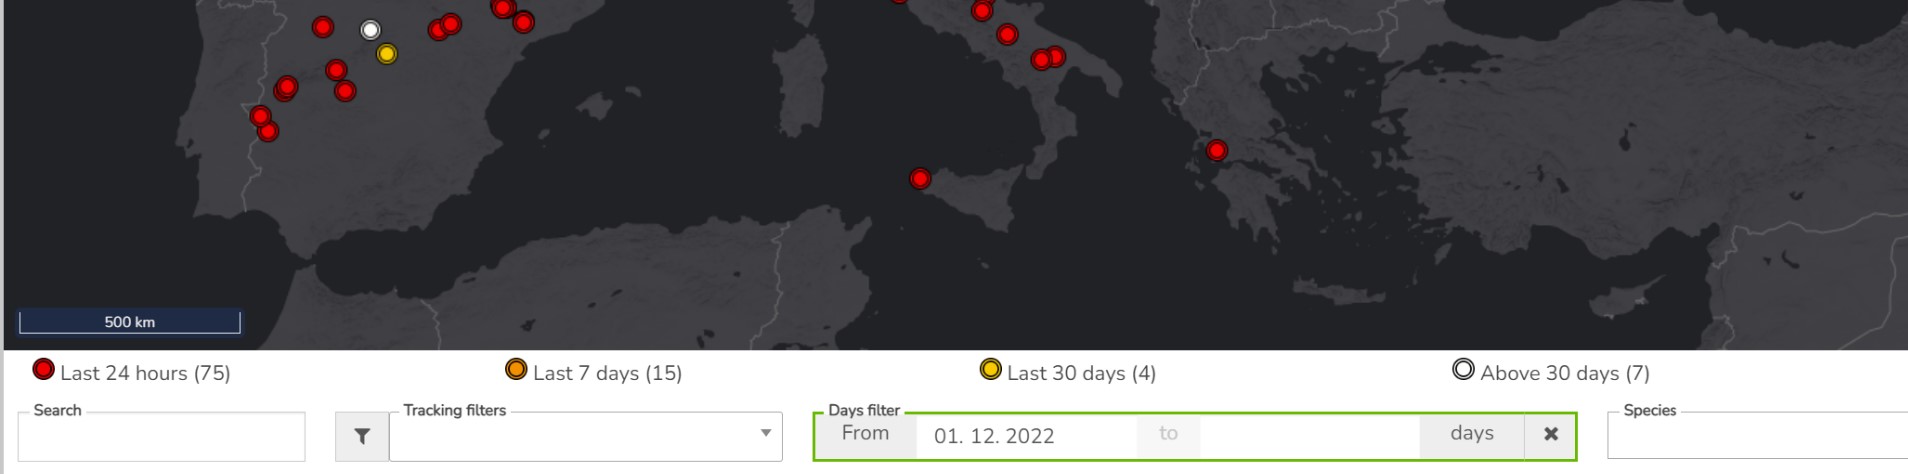
- Also note the map filter is stored in the URL (browser address bar). You can open another browser tab with a map page and configure a different filter (eg. another species). Both tabs then work independently.
Choosing Trackings / Animals to be loaded in the map.
- using tooltips of single last points
- or for multiple items using the rectangle tool selection in the map (using CTRL + click/drag with left mouse button)
- selecting/unselcting particular items in the right Tracking pannel (single Trackings or all grouped by species)
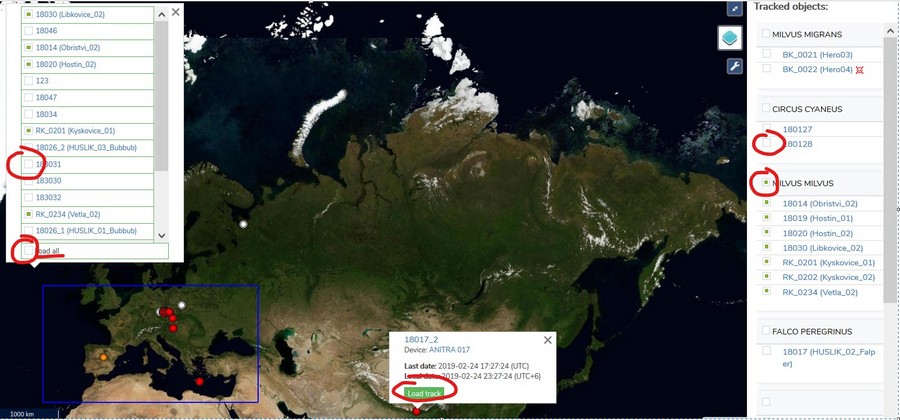
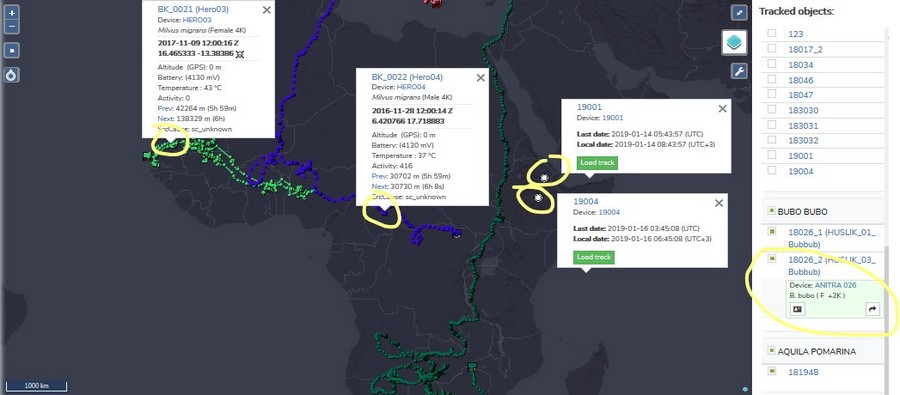
Waypoints and Last positions (tooltips)
- More tooltips can be displayed simultaneously
- Click through the link to a particular Tracked Object profile
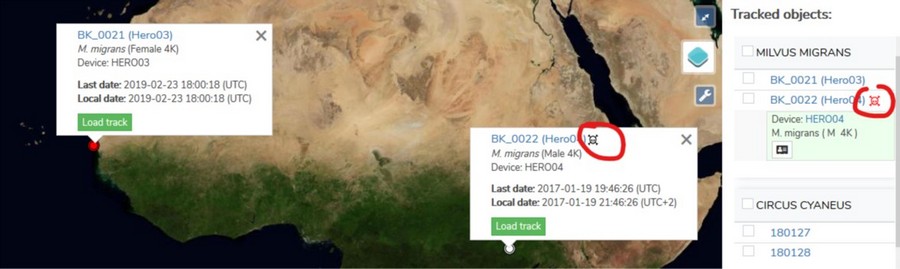
- Warnings and statuses are shown in tooltips e.g. mortality being indicated by black/red symbols
MAIN MAP (POIs & Events): More context to your telemetry
Points of Interest, Events (and Geography) are supporting datasets that give the telemetry its context. They are shown from a panel on the left side of the map, opened by the marked symbol. The panel can be resized by dragging its edge and collapsed at any time, even while it is still loading.
POIs - Points of Interest: places that matter to your work, such as nest sites, wind turbines, power pylons or known poisoning locations
Events - Observations: something that happened at a place and time
Geography - a geography structure/hierarchy
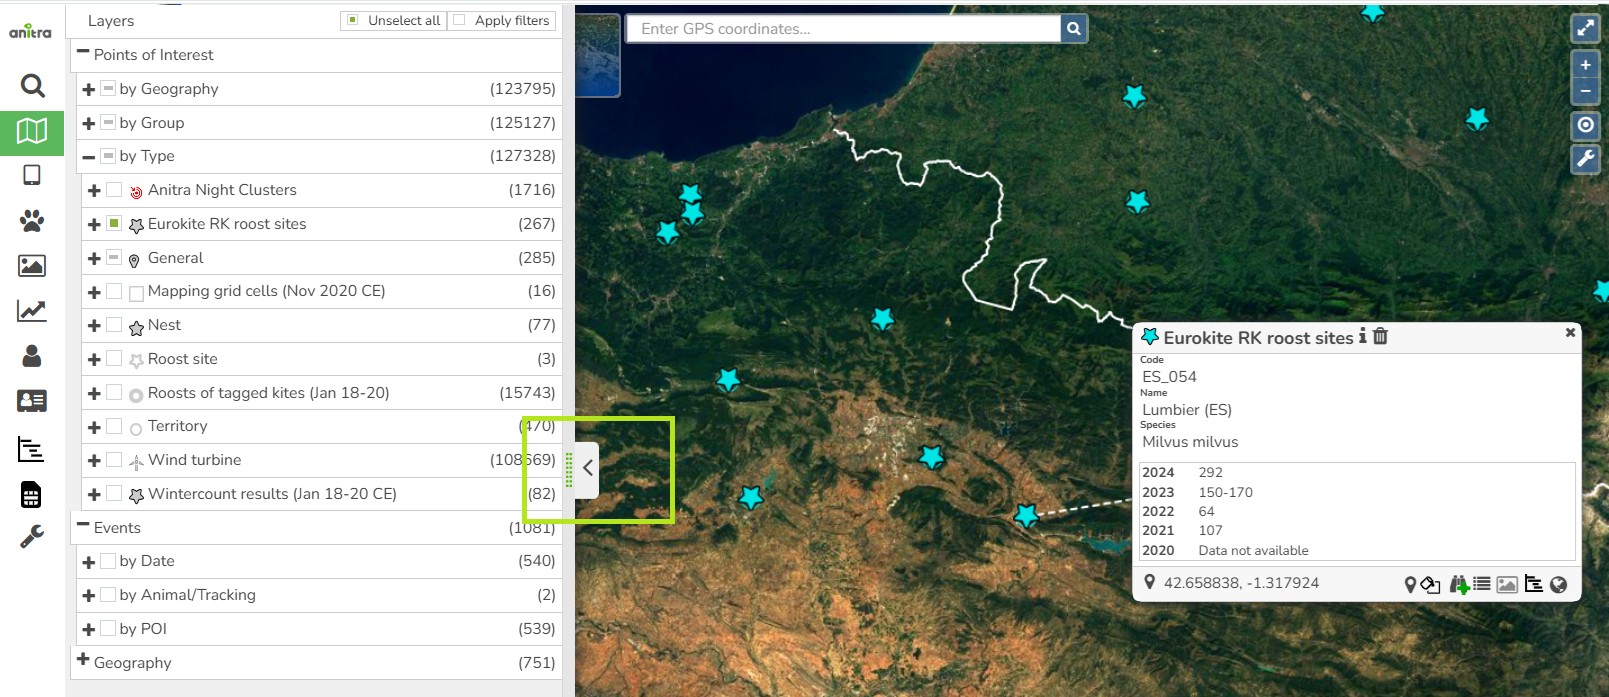
The panel works on its own - you do not have to load or select any tracking first, so the supporting datasets can be browsed over an empty map.
Three ways to browse the same Point of Interest. Each is a drill-down tree and you can open it down to a single item.
- by Type - grouped by what the point is
- by Group - grouped by the dataset it belongs to
- by Geography - country, region, district
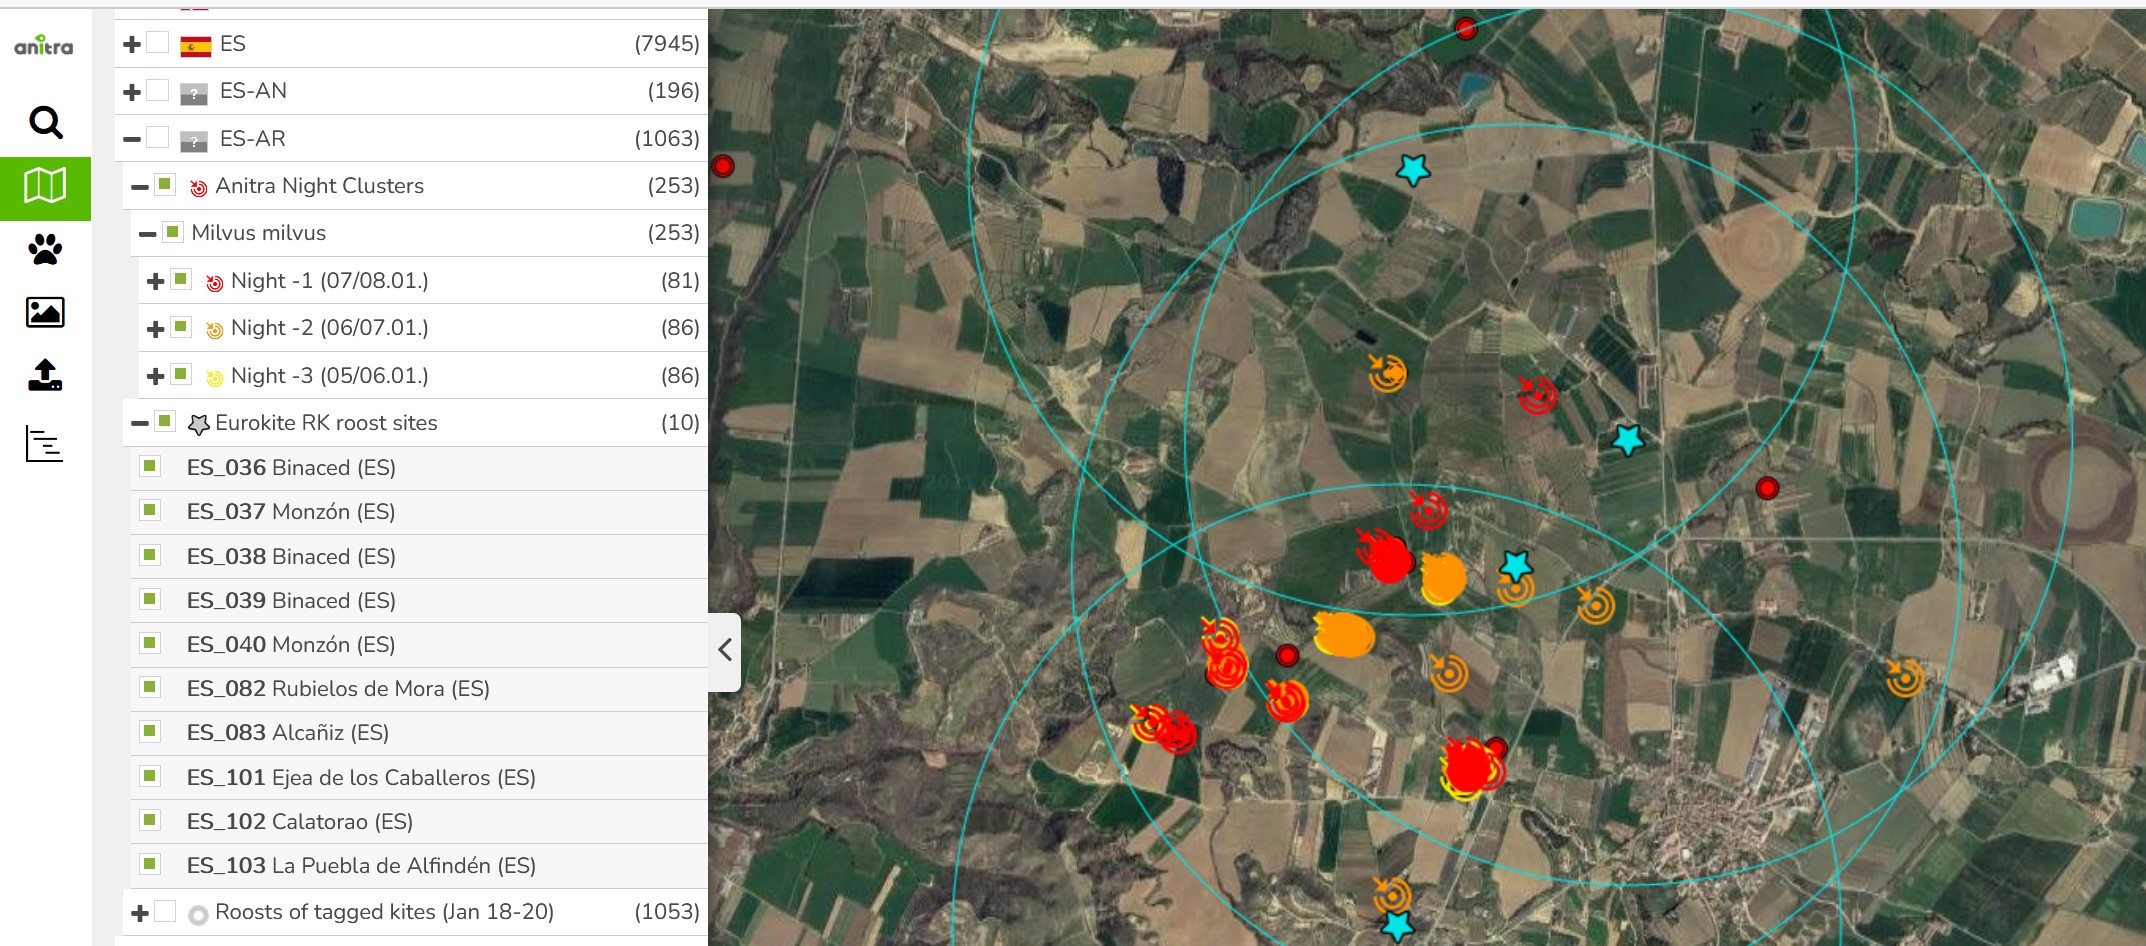
- The same point can appear in more than one tree. Showing or hiding it anywhere takes effect everywhere, so the map always agrees with what is ticked.
Showing and hiding. Every level has its own tick box, so a whole country, a whole group or a single point can be switched on and off in one click. A box that is only partly filled means some of the branch is shown and some is not; clicking it clears the rest of the branch first.
The number next to a branch counts what the branch would show with the filters you currently have set. Note that the time filter below the map applies here too - with a narrow time window, regions whose points fall outside it will not appear in "by Geography" at all.
Deleting a point is offered from any of the three trees. Some points cannot be deleted - typically because an Event is linked to them - and the application tells you which reason applies.
Seeing the details works the same as for tracking points: hovering shows the info, left click opens and pins it, double click opens edit mode for objects you may edit, i.e. POIs or Events you created yourself.
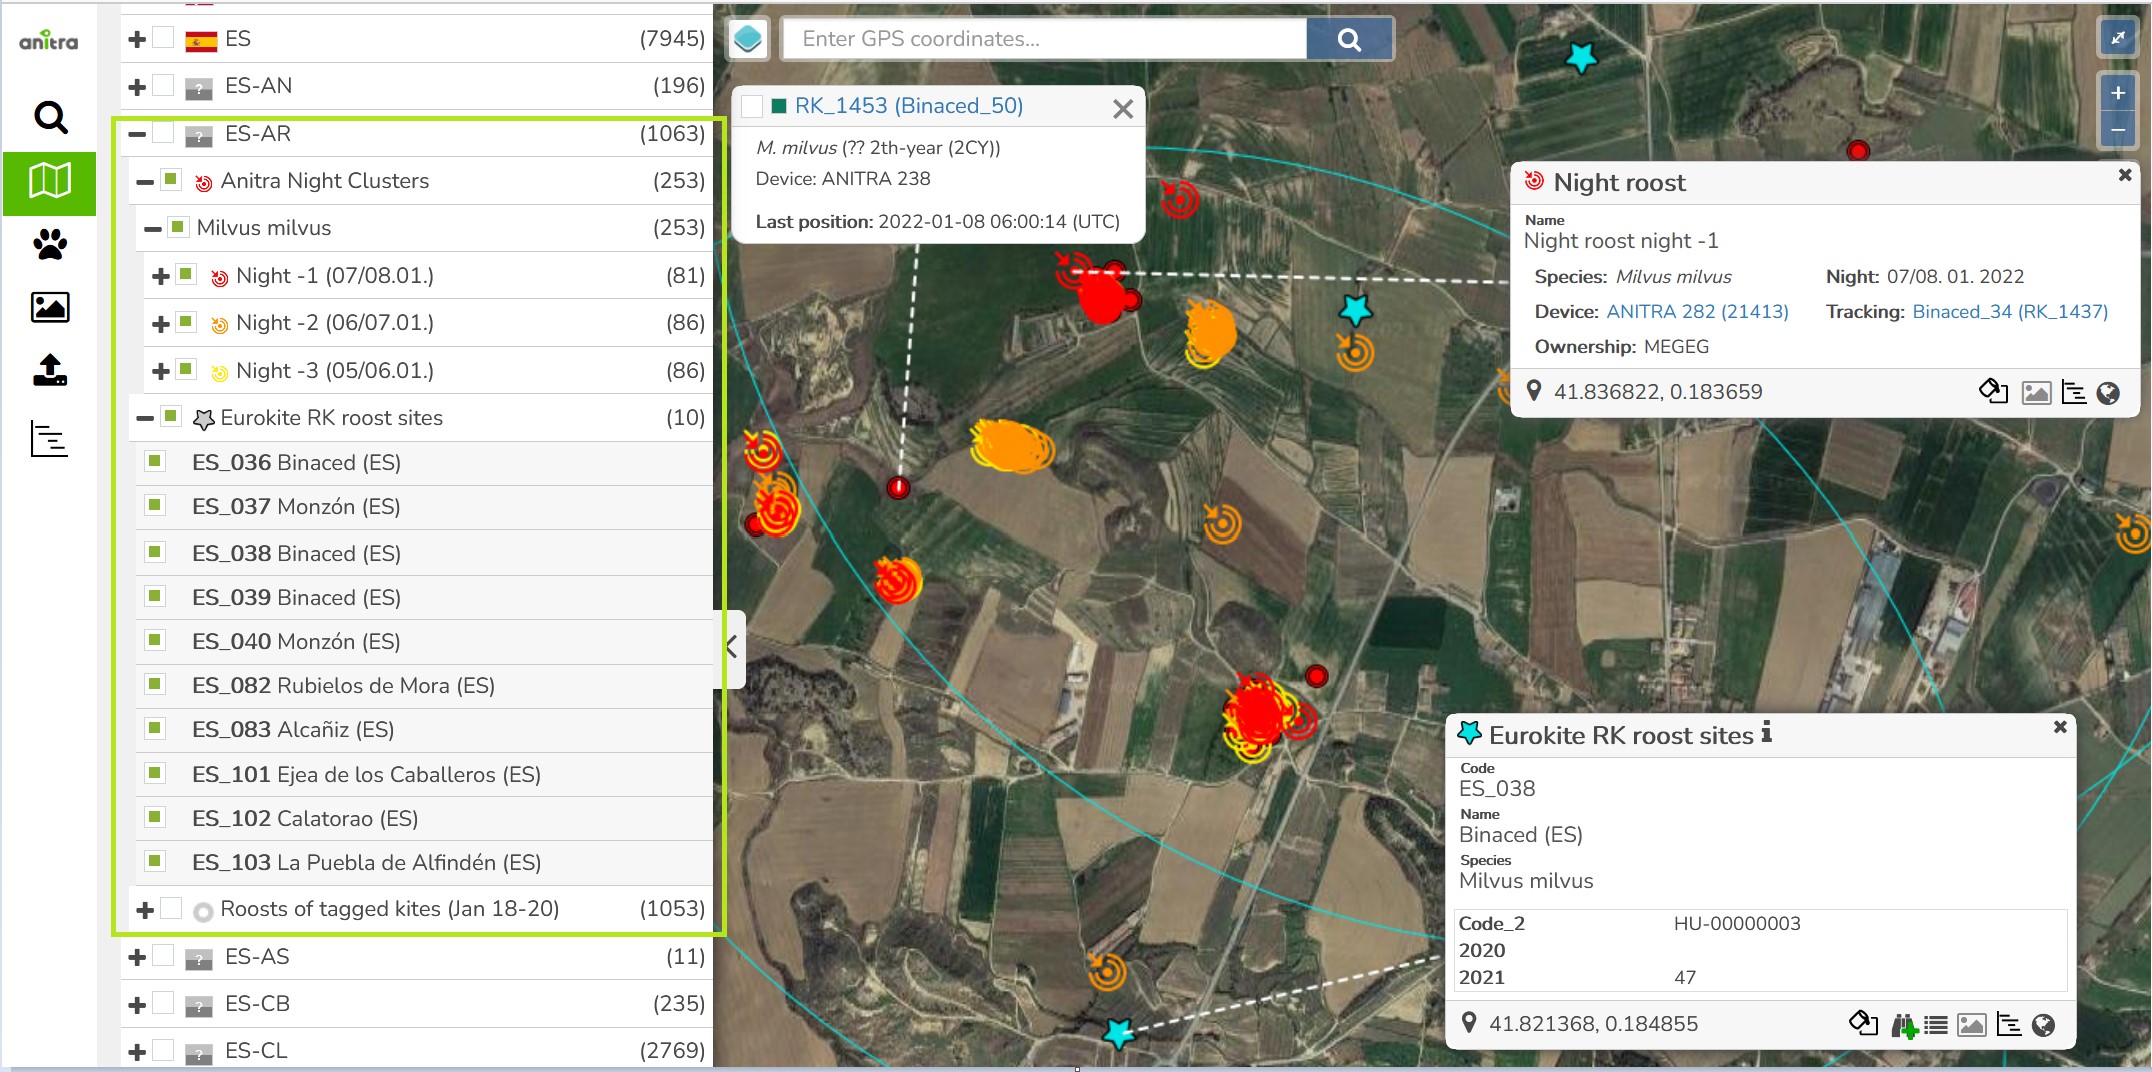
The "Geography" branch a special purpose visualisation of the borders of available geo hierarchy items (country, admin1, and admin2). This split only shows the borders with no leaves (POIs or Events). To see the POIs organized by geo hierarchy use "By Geography" POI split.
PUBLISHED MAPS: How do I show an overview of our study results to the public?
A detailed guide to to Published maps functionality is available here.
A tool tailored to configure simplified and secured live telemetry maps from your full data sets.
Configured maps are available in form of a link or in form of short HTML code which can be simply added to your web presentation or published on Facebook.
Map output can be created:
- on top of single organization data
- on top of "project" (i.e. accross more complex data ownership structure)
Map editor with a live preview is used to configure the map
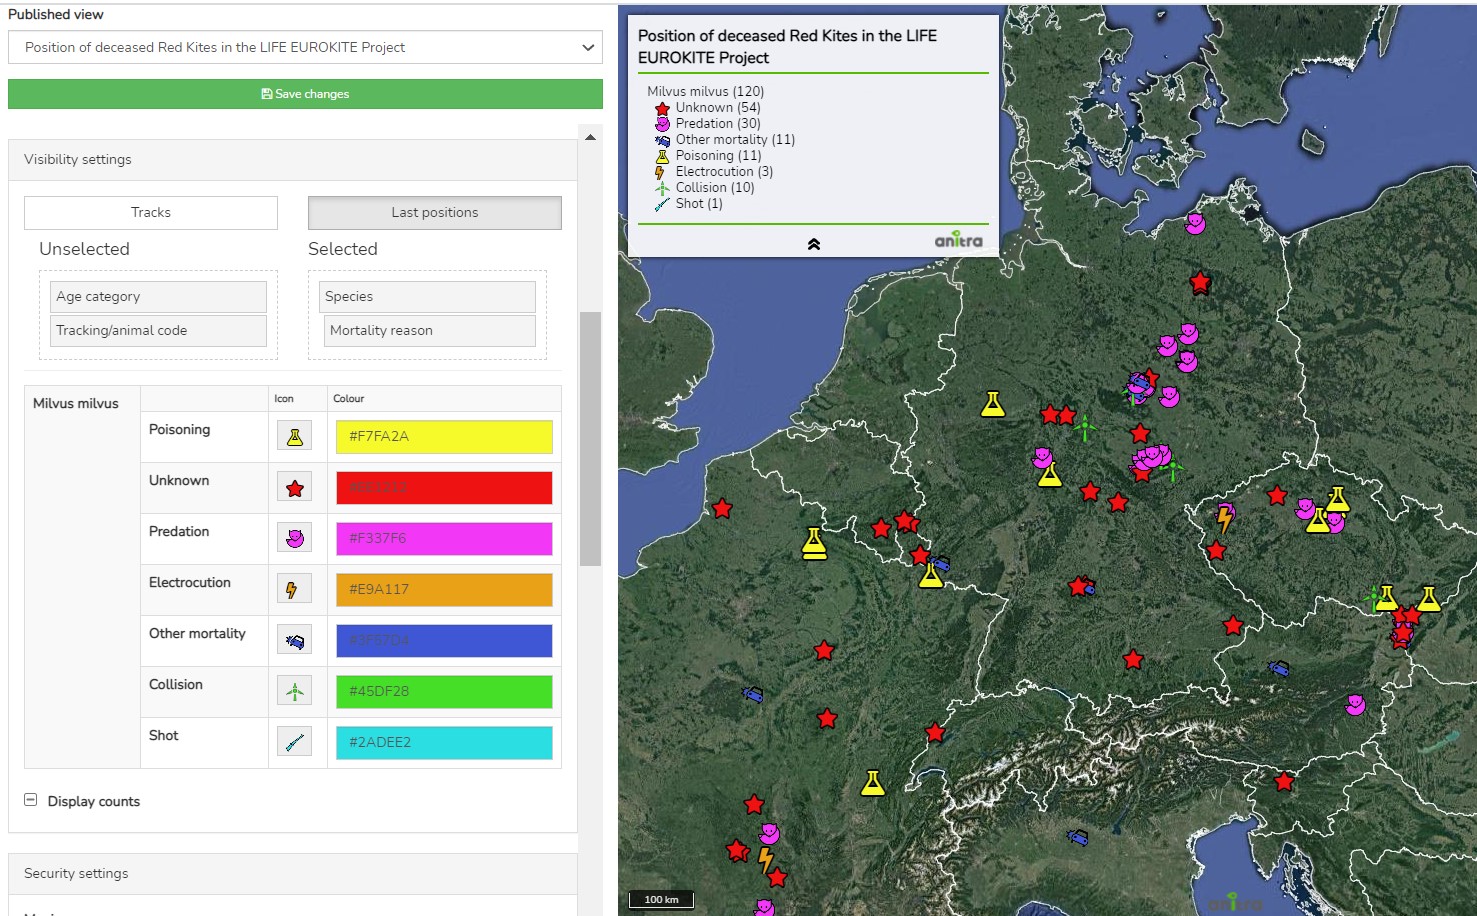
Two map modes can be configured:
- map showing the simplified Tracks
- map showing the Last positions only
For the mode of "Tracks" Animation can be anabled
The map configuration includes:
- animal selection
- language localisations (alternative language variants)
- map mode (tracks vs. last position), grouping options, ordering, data filtering (e.g. track simplified to one position a day)
- security features (security delay, zoom restriction, position "rounding")
- presentation and visualization presets (a default map selection, icon/track styles, choice of icons, logos with links, foto gallery, animation enabling)
Samples showing some of the map features
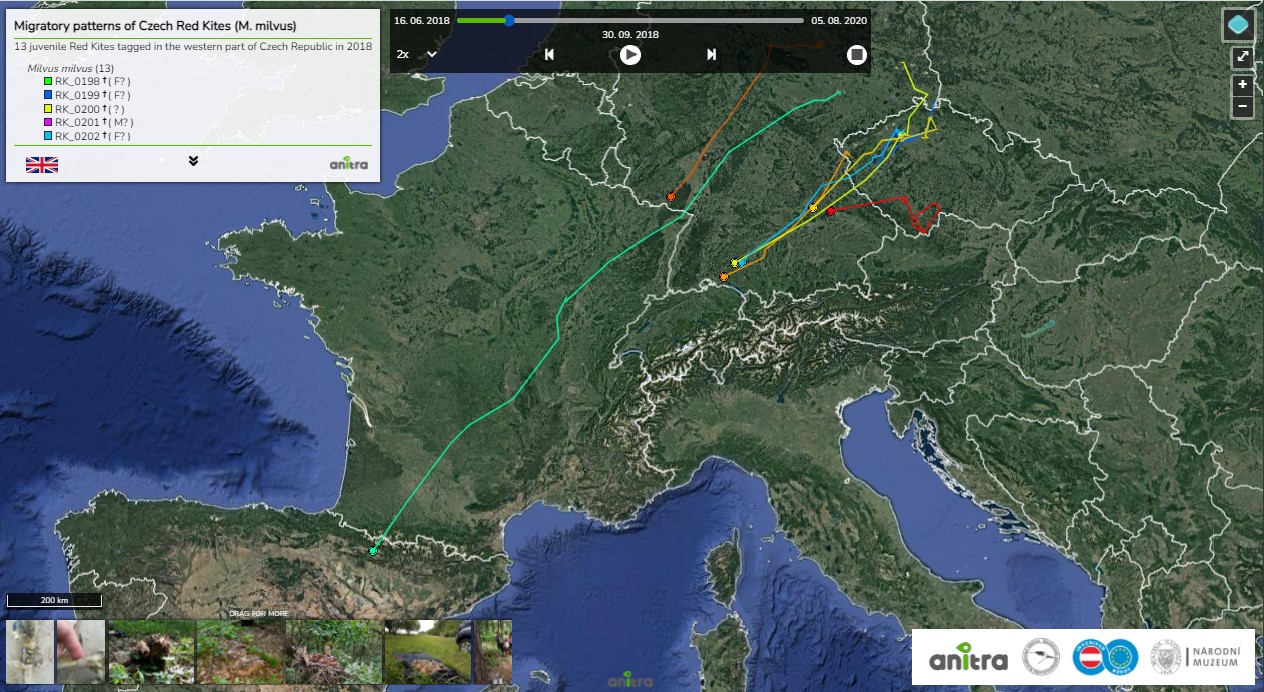
- map with tracks and gallery and animation anabled:https://app.anitra.cz/share/map/5d2e379ed6f9c
- map of last positions with categories: https://app.anitra.cz/share/map/5f1a97bb13ba5
A detailed guide to to Published maps functionality is available here.