Graphs
Graph functionality available
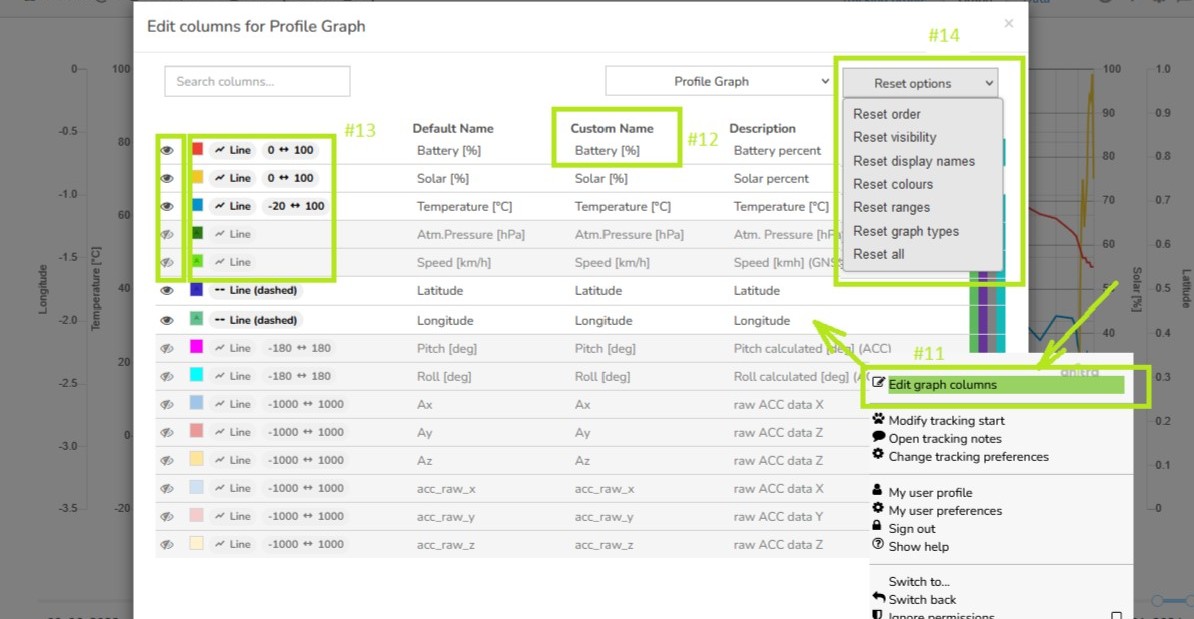
- as a tab in Device and Tracking profiles (see #0)
- for a group of Devices (only admin functionality now).
Time is indicated by the horizontal axis (see #1)
By default period of the last 7 data days is loaded.
The interval shown can be managed either by the interval slider (see #2) or using the date input below the chart area (see #3).
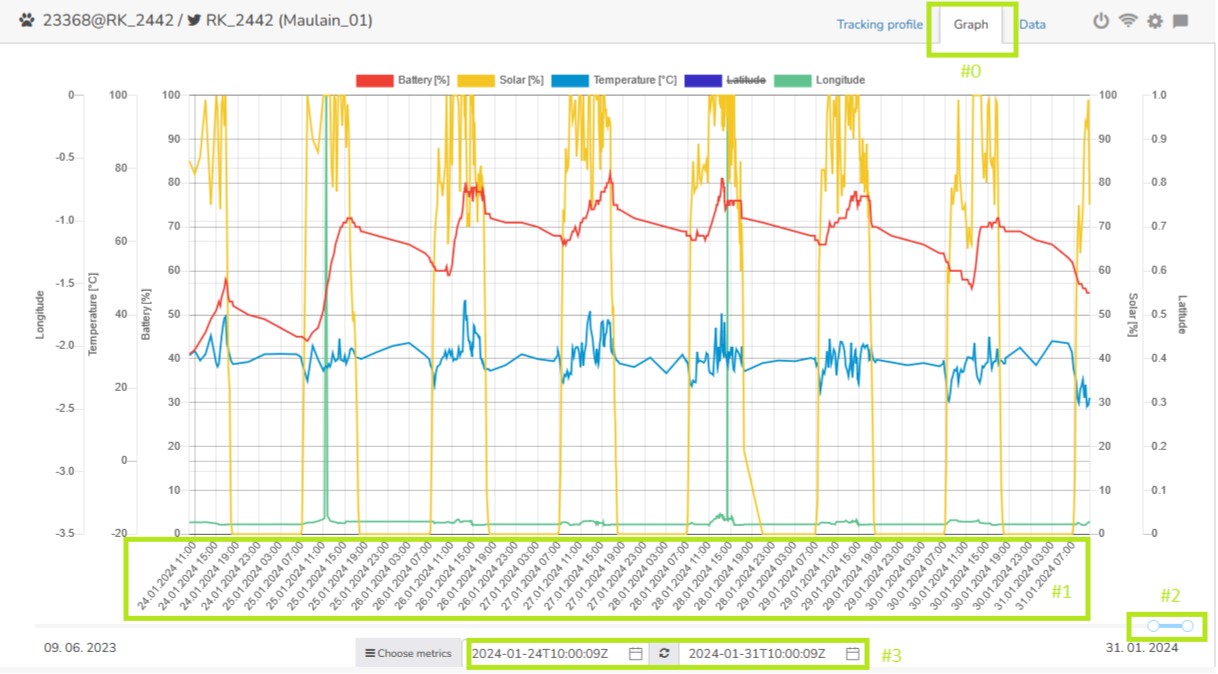
You can hover over the chart to preview the actual values (see #4).
The values of metrics are plotted at the vertical axis of the graph (see #5).
The scale for a particular metric is shown on the left and right from the graph area (see #6).
To quickly show/hide a particular metric click the label color above the graph (only used till the next page reload)(see #7).
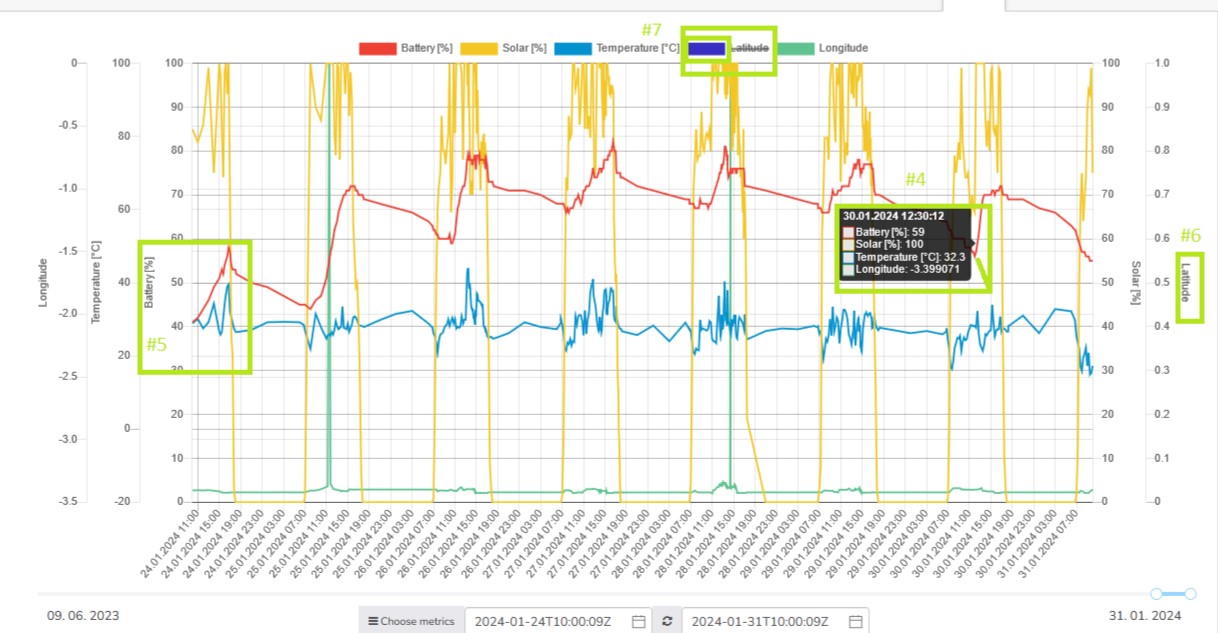
You can customize your metric list (visibility) and order using the "Choose metrics" button below the chart (see #8).
Visibility (see #9) and order (see #10) is controlled by drag'n'drop action.
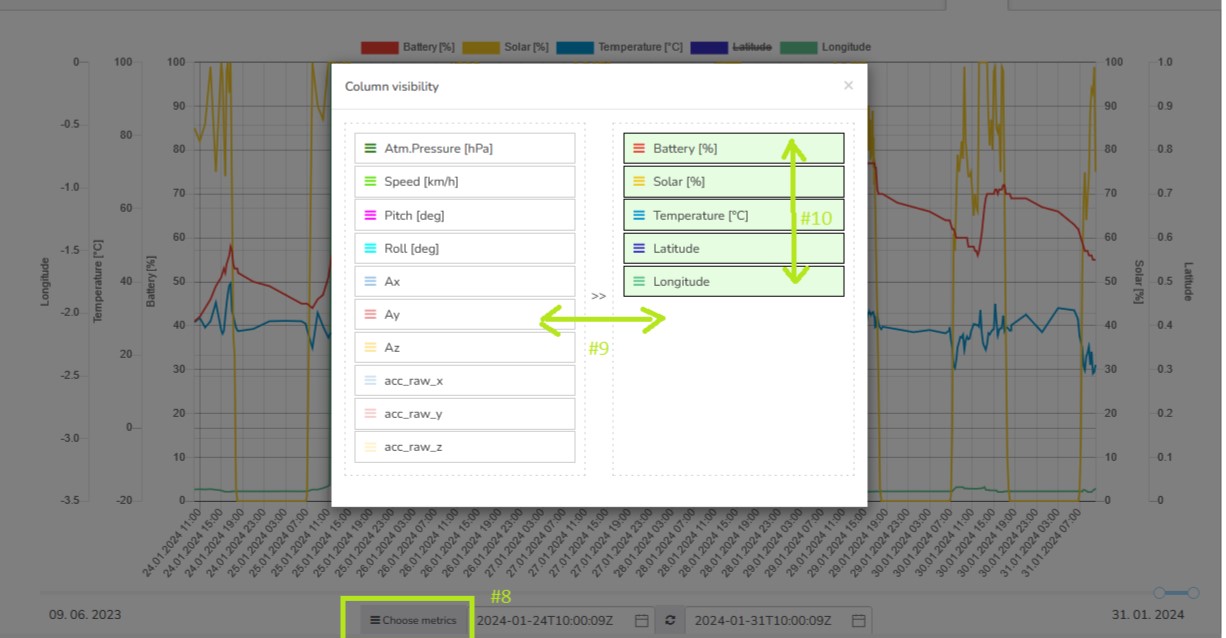
Visibility and order can also be managed in "Edit graph columns" from the context menu (see #11).
Additionally, this functionality offers even more properties to be controlled such as custom rename (see #12) or colors, graph type, and default value range (see #13).
It also allows resetting the changes to system defaults (reset options in the top right corner)(see #14)